Executive Summary
To understand economics and the underlying forces that propel markets, one must understand consumers and working people. In the scope of international markets, this report will shed light on one of the largest and most fundamental drivers: the global middle class, which currently spends $35 trillion annually (2011 PPP) and could be spending $29 trillion more by 2030 — accounting for roughly a third of projected global GDP growth.1
To understand economics and the underlying forces that propel markets, one must understand consumers and working people. In the scope of international markets, this report will shed light on one of the largest and most fundamental drivers: the global middle class, which currently spends $35 trillion annually (2011 PPP) and could be spending $29 trillion more by 2030 — accounting for roughly a third of projected global GDP growth.1
This research report seeks to understand how many people belong to the global middle class. To understand the question meaningfully, it is essential to first consider how “middle-class” is defined. The preexisting notions vary widely and are often grounded in national, cultural, and social frameworks. Some definitions emphasize credentials, such as educational attainment or professional status, while others focus on cultural markers — for example, values, aspirations, or lifestyle choices that reflect a middle-class identity.2 In many cases, especially across different regions, being middle class may be more about a sense of stability or respectability than a strict income level. While these interpretations are meaningful, we choose to define middle-class status not by country or region but by a universal standard that captures the economic position of consumers worldwide.
This report aims to quantify the size of a global middle class and establish a methodology for measuring its scope, and to fill a gap in economic research that fails to consider the consumer as a global player. We compare the economic middle-class of emerging markets (EMs) and
developed markets (DMs) to highlight key trends and disparities. By leveraging economic indicators such as inflation and GDP, we can prove the significance of the global middle class and draw conclusions to the direction of worldwide consumer trends—drawing on key knowledge derived from, thus far, unexplored perspectives of an amalgamated global middle class.
developed markets (DMs) to highlight key trends and disparities. By leveraging economic indicators such as inflation and GDP, we can prove the significance of the global middle class and draw conclusions to the direction of worldwide consumer trends—drawing on key knowledge derived from, thus far, unexplored perspectives of an amalgamated global middle class.
Key Terms: Global Middle Class (GMC), emerging markets (EMs), developed markets (DMs), mean income, mean consumption, purchasing power parity (PPP)
Defining “Middle Class”
The first step in analysing trends and estimating the size of the global middle class is to establish a clear definition. It is important to distinguish this concept from classifications such as middle-income countries or national middle classes, as those are region-specific and do not lend
themselves to a worldwide comparative analysis. Our research seeks to determine the total number of individuals worldwide who fall within the middle segment of all consumers, answering the question: Out of the ~8 billion people on Earth, how many belong to the middle class?
To define this group, we must first establish a consistent and measurable metric. Various definitions exist, often influenced by factors such as political structures, entrepreneurship, and human capital, which vary across countries. For our analysis, we define the middle class based on daily income in 2017 purchasing power parity (PPP) U.S. dollars. This metric is chosen because:
1. PPP allows for standardised comparisons across countries by adjusting for inflation and cost-of-living differences.
2. PPP is an objective, quantitative measure, free from subjective or policy-driven interpretations.
3. PPP provides a simple yet effective way to ensure an even playing field, making cross-country analyses more reliable.
4. Other researchers have used PPP to define the global middle class’ lower and upper income bounds (Kharas 2023)
For consistency, we set the standard to measure income in 2017 PPP dollars, standardized and adjusted for inflation, as this year offers the most comprehensive and widely available global data, as well as relative insulation from the geopolitical tensions and pandemic-induced market variability. To clarify, this does not invalidate any trajectories as described by the data but rather serves as a stable basis for comparison.
In the limited scope of previous research, we acknowledge a definition set by economist Homi Kharas, to define the global middle class as a consumer with an income between $10 and $110 dollars (PPP)3. Kharas creates this line to exclude “those who are considered poor in the poorest advanced countries and those who are considered rich in the richest advanced country”, decreeing anyone falling in between these figures in the composition of the global middle class. Notably, this definition is based on the 2005 PPP; however, we back this definition based on the same underlying premise: that the global middle class should reflect those with sufficient disposable income to participate meaningfully in consumer markets, without qualifying as either globally poor or rich. For example, a household earning $20 per day (PPP-adjusted) may not be considered wealthy in its local context, but it demonstrates the ability to make regular discretionary purchases—such as household appliances, mobile services, or basic financial products—which positions it squarely within the emerging global middle class. This functional approach to defining the middle class enables a more accurate analysis of shifting consumption patterns and population dynamics across regions.
In the limited scope of previous research, we acknowledge a definition set by economist Homi Kharas, to define the global middle class as a consumer with an income between $10 and $110 dollars (PPP)3. Kharas creates this line to exclude “those who are considered poor in the poorest advanced countries and those who are considered rich in the richest advanced country”, decreeing anyone falling in between these figures in the composition of the global middle class. Notably, this definition is based on the 2005 PPP; however, we back this definition based on the same underlying premise: that the global middle class should reflect those with sufficient disposable income to participate meaningfully in consumer markets, without qualifying as either globally poor or rich. For example, a household earning $20 per day (PPP-adjusted) may not be considered wealthy in its local context, but it demonstrates the ability to make regular discretionary purchases—such as household appliances, mobile services, or basic financial products—which positions it squarely within the emerging global middle class. This functional approach to defining the middle class enables a more accurate analysis of shifting consumption patterns and population dynamics across regions.
To estimate the size of the global middle class, we analysed the Poverty and Inequality Indicators dataset from the World Bank’s Poverty and Inequality Platform.
A concern to the middle class bounds we established to define our middle class, was that they will be inaccurate when observing broadly over a timespan of over 20 years—in the beginning
of our observations the threshold of $10 per day would exclude a massive portion of population that accounts for the influx of individuals into the GMC, therefore skewing our data and showing an improbable number of entrants to the middle class. However, using PPP in terms of 2017 as the
metric accounts differences in time and inflation—providing one single standard isolated metric for daily income per person. This means that income per person per day at $10 is the same in 2025 as in 2001, according to our metric, and therefore our data is sound.
Another concern was data being measured as “income” and “consumption”. For each country sampled, the “mean” as described in the methodology section is presented as mean consumption, or mean income. Consumption is correlated with income but cannot be presented as
a 1:1 comparator. We ran into this issue when cleaning the data. Accordingly, we run on the assumption supported by research, that World Bank systematically changes the type of data collected but uses consumption as a proxy for income in less formalised labour markets. To clarify, in countries where the labour sector is comprised of a large portion of informal work yielding inconsistent income rather than salary, consumption yields more accurate data on living standards and economic well-being than reported income. Therefore, our analysis will include a middle-class population estimate both from countries analyzed via income and consumption. However, because these cannot be compared directly, labels specify which method was used to extract the numbers.
Methodology
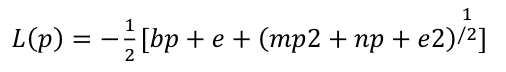
The method we use to estimate each country's middle class relies on the Lorenz curve. The Lorenz curve is a function used to model income inequality in a population. Its value, L(p), is defined as the proportion of the society's total income shared by the proportion p of the population who have the lowest income. In other words, the p with lowest income makes L(p) of the total income. The Lorenz curve makes two important assumptions. First, it assumes that everyone makes non-negative income, which means L`(p)≥0. Next, it assumes that p is ordered from lowest
to highest income, which means L``(p)≥0.
a 1:1 comparator. We ran into this issue when cleaning the data. Accordingly, we run on the assumption supported by research, that World Bank systematically changes the type of data collected but uses consumption as a proxy for income in less formalised labour markets. To clarify, in countries where the labour sector is comprised of a large portion of informal work yielding inconsistent income rather than salary, consumption yields more accurate data on living standards and economic well-being than reported income. Therefore, our analysis will include a middle-class population estimate both from countries analyzed via income and consumption. However, because these cannot be compared directly, labels specify which method was used to extract the numbers.
Methodology
The method we use to estimate each country's middle class relies on the Lorenz curve. The Lorenz curve is a function used to model income inequality in a population. Its value, L(p), is defined as the proportion of the society's total income shared by the proportion p of the population who have the lowest income. In other words, the p with lowest income makes L(p) of the total income. The Lorenz curve makes two important assumptions. First, it assumes that everyone makes non-negative income, which means L`(p)≥0. Next, it assumes that p is ordered from lowest
to highest income, which means L``(p)≥0.
Our computation relies on a key insight: because L(p) is proportional to the cumulative income, this means its derivative, L`(p), is proportional to the income made by each person. In the situation where every member of society has the same (average) income, the Lorenz curve is a straight line with derivative 1. Therefore, no matter the shape of the curve, the derivative at any point p equals the scale, relative to the average income, made by people at p. By our definition of the middle class, the lower and upper bounds of the middle class are p where L`(p) corresponds to $10 USD and $110 USD daily, respectively.
Using this insight, we estimate each country's middle-class population for each year as follows:
First, using the income deciles, we construct a Lorenz curve. We chose to use the general quadratic form of the Lorenz curve, defined as follows:
First, using the income deciles, we construct a Lorenz curve. We chose to use the general quadratic form of the Lorenz curve, defined as follows:

Solving for L:
Where

(Datt 1998: 6).
Following Datt (1998: 9), we use linear regression to derive the three Lorenz curve parameters (a, b, and c), treating the nine intermediate deciles as nine observations.
Then, we identify p where L`(p) corresponds to $10 USD and $110 USD, respectively. Because we chose to use the general quadratic form, we can derive p from L`(p) using an efficient closed-form solution rather than a time-intensive computational approximation As specified by Datt (1998: 14):
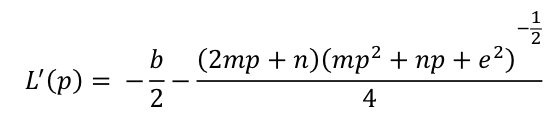
We solve for p:

Where:

We apply the quadratic formula and choose the solution p with the correct L`(p). If p falls below 0 or above 1, we adjust p to equal 0 or 1, respectively.
There are some limitations to our analysis. First, we assume a specific functional form for the Lorenz curve to ensure computational efficiency. The World Bank PIP Methodology describes that one of two functional forms are used: either general quadratic or Beta, whichever fits better. So, our choice of functional form may not be the optimal fit. Additionally, our data is subject to the limitations of the data collection method.
Data
The central mission of this research is to estimate the number of people who constitute the global middle class. To do this, we combine the calculated population of every sampled country with available data in the last largely available year, 2021. Not every country was measured for this dataset in 2021, and global data available for the year comes from the countries:
Armenia, Austria, Belgium, Benin, Burkina Faso, Bulgaria, Bolivia, Brazil, Central African Republic, China, Cote d’voire, Cameroon, Colombia, Costa Rica, Cyprus, Czechia, Denmark, Dominan Republic, Ecuador, Spain, Estonia, Finland, France, United Kingdom, Georgia, Guinea-Bissau, Greece, Croatia, Hungary, Indonesia, India, Ireland, Iran, Israel, Italy, Jamaica, Kazakhstan, Kenya, Krygyz Republic, Republic of Korea, Lithuania, Luxembourg, Latvia, Moldova, Mali, Montenegro, Malaysia, Niger,
Netherlands, Panama, Peru, Philippines, Poland, Portugal, Paraguay, Romania, Russia, Senegal, El Salvador, Serbia, Slovakia, Slovenia, Sweden, Togo, Thailand, Tonga, Tunisia, Turkiye, Uruguay, and the United States
In 2021, these 70 countries held 5,106,556,714 out of the world’s 8.062 billion people. According to our analysis, a total of 2,321,017,467 people in these country, or 45.5% of them, were members of the global middle class. The presence of a substantial middle class could signal improving economic conditions in many regions, supporting demand for education, healthcare, and consumer goods. At the same time, since more than half of the in this group of countries remain outside the middle class, our analysis highlights ongoing challenges with inequality and economic vulnerability.
Using this methodology, we were unable to provide a comparison for growth over years of the middle-class population. However, reviewing literature provided by Kharas and Brookings, their estimate lies at 3.2 billion individuals in the middle class at the end of 2016, with an estimated growth of 140 to 170 million per year5. Our estimation finds the middle class to have increased by a staggering 59% during this time, meaning the population growth reflected an entry of close to 215 million individuals per year over the nine years since the study done by Brookings. This does not account for fluctuations in year-by-year growth; rather, it shows that the middle class is growing faster than previously. This is significant in conjunction with western trends of a compressing middle class, to support the evidence of a global emergence in middle class development.
Analysis
EM vs. DM Comparison
This section demonstrates a visual comparison of EM and DM Markets in terms of total population growth, population growth year over year, total global middle class growth, global middle class growth year over year, and GDP growth year over year. Figure 1 compares India and South Korea from 2017 to 2021, and points to correlations regarding economic shocks and class structure.
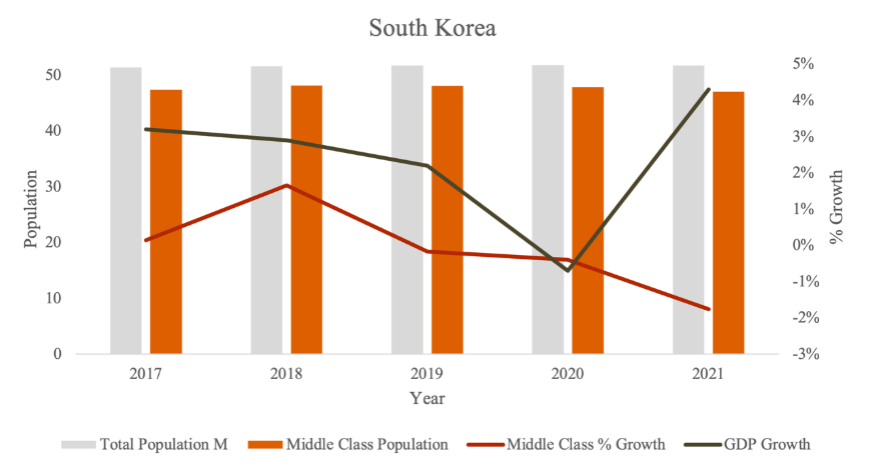
Figure 1: India (consumption)/South Korea (income) 2017-2021
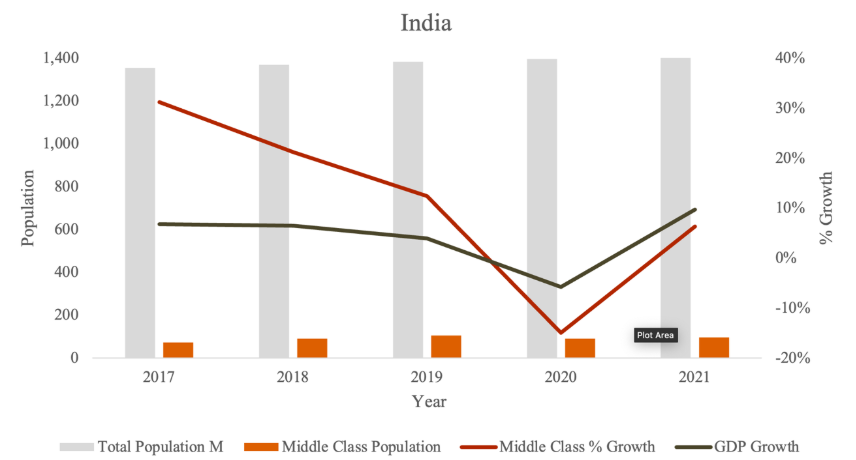
India showcases extreme GDP volatility, with a plunge to -15% in 2020 and a rebound above 10% in 2021. Midde-class growth contracted sharply during the pandemic but began to recover alongside the economy. Despite steady population growth, India’s GMC remains a small fraction of its overall population in 2021. This highlights demographic pressure and a sensitivity between economic growth and middle-class expansion in Emerging Markets. Since 2021, India’s GDP has shown consistently high growth. With this correlation, we speculate that the middle class has shown growth as well.
ROK GDP declined modestly in 2020, followed by a moderate recovery in 2021. However, the middle class population steadily declined. In the ROK, however, this could be a sign of upward mobility as the population brings in higher income, and out of the upper bound of $110 PPP. With a relatively flat growth rate of the total population, this trend suggests a shift in where affluence rises and redefines ROK as a consumer on the global scale. Note that the average percent change observed in the ROK is much lower than in India, in line with expectations for a developed market. With recent political instability, and low GDP growth, revisiting the case of South Korea with updated statistics can provide further insight into the relationship between economic stability and GMC growth.
Drawing comparison between different pairs of EM and DM countries, with comparable data availability reinforces the idea that EM middle class is more precarious, and DM middle class are nearing stable saturation. The same trend can be found when examining China/UK, and Brazil/US GDP, GMC, and Population growth statistics.
Growth by Region
The following section demonstrates the growth of the GMC by region and nation. Data is only shown for countries with statistically significant inputs, meaning there are 12 or more data points observed from 2001 to 2021.
The following section demonstrates the growth of the GMC by region and nation. Data is only shown for countries with statistically significant inputs, meaning there are 12 or more data points observed from 2001 to 2021.
Figure 2 illustrates the global distribution of the middle-class population in 2021, measured by income (top map) and consumption (bottom map). The income-based map shows higher middle-class proportions in regions such as Europe, North America, and parts of South America, indicated by lighter green and yellow shades. In contrast, the consumption-based map highlights significant middle-class representation in South and Southeast Asia, as well as parts of the Middle East, while Sub-Saharan Africa remains predominantly in the lower range. This comparison underscores the disparity between income and consumption metrics, revealing that regions with lower incomes may still exhibit substantial consumption-driven middle-class characteristics.
Figure 2: Proportion of Population in GMC (income/consumption)
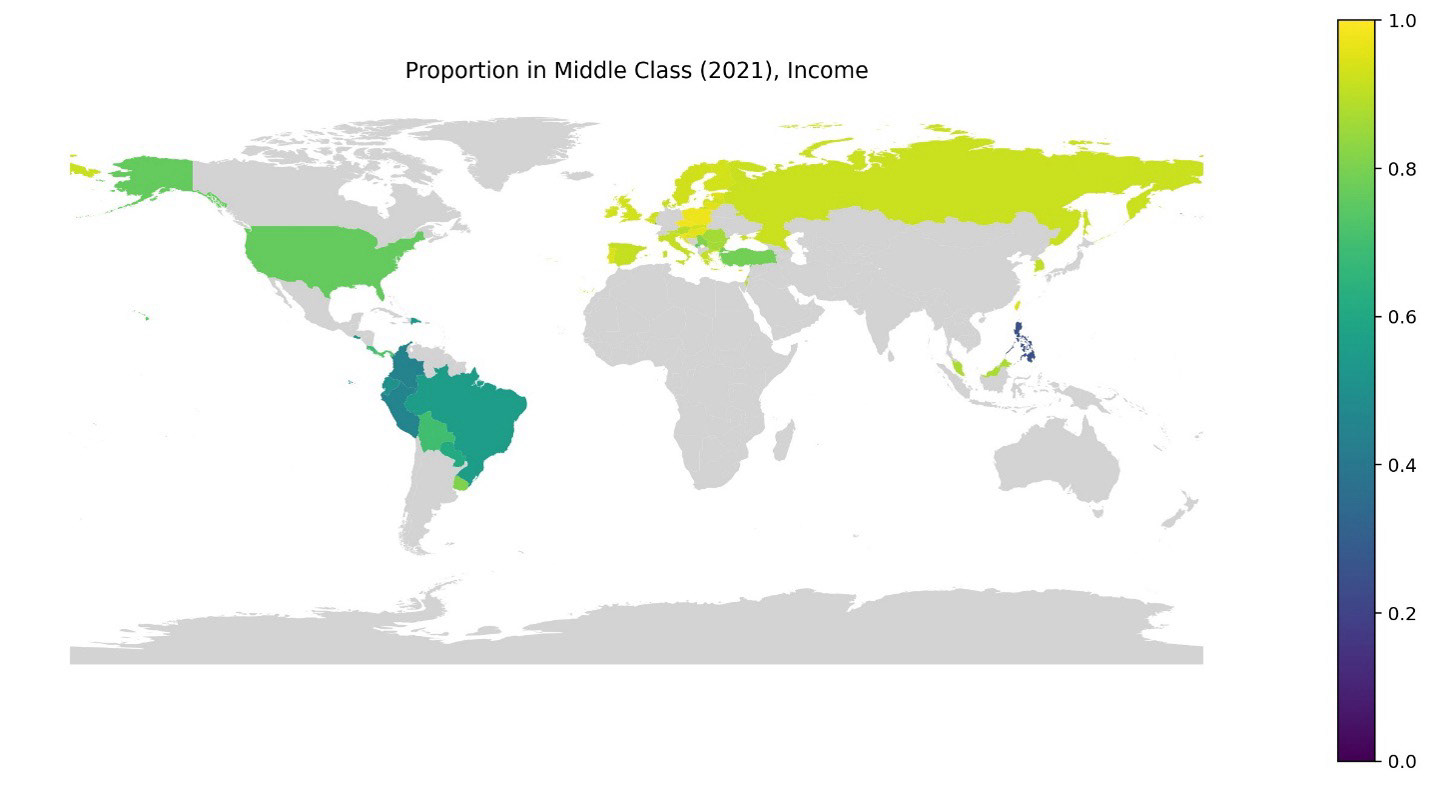
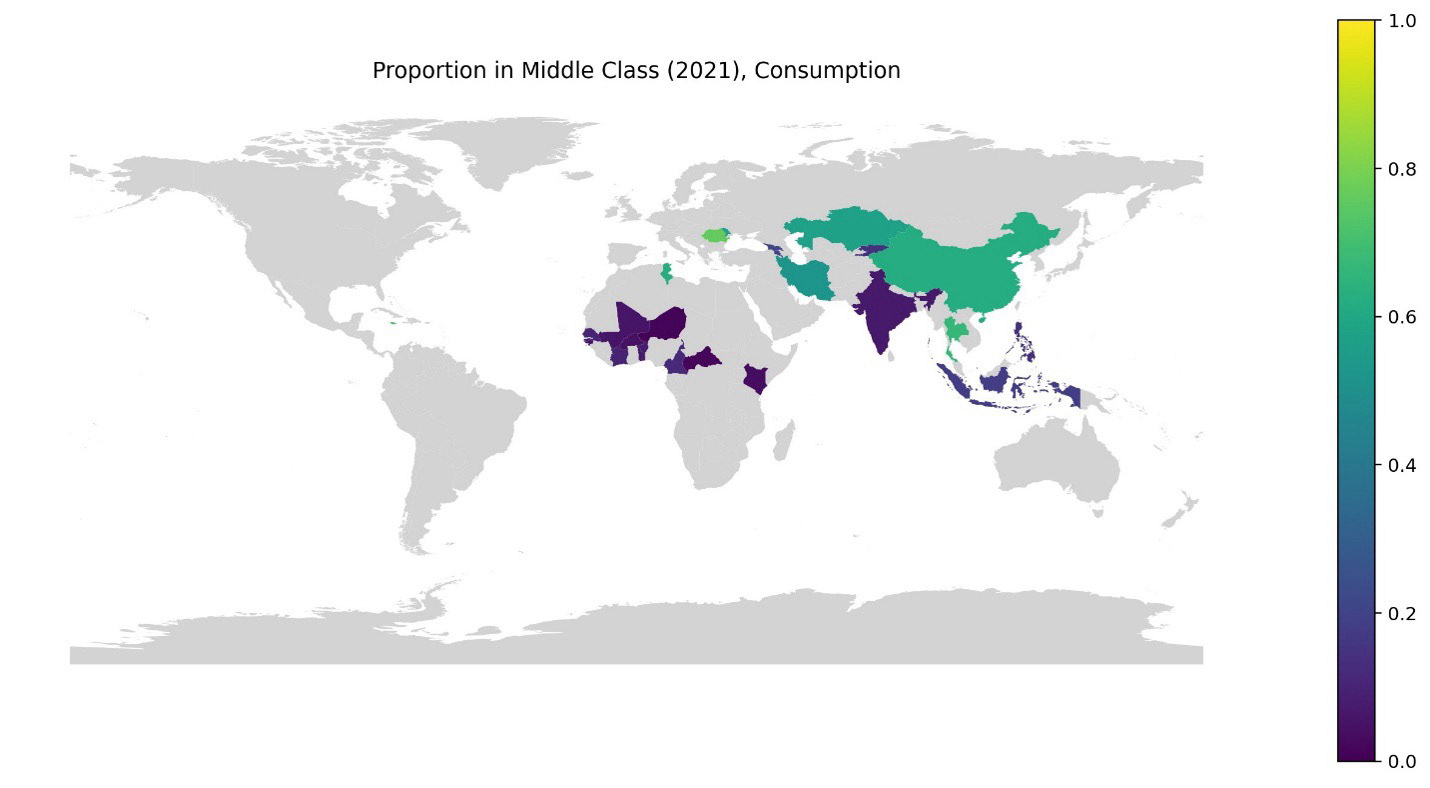
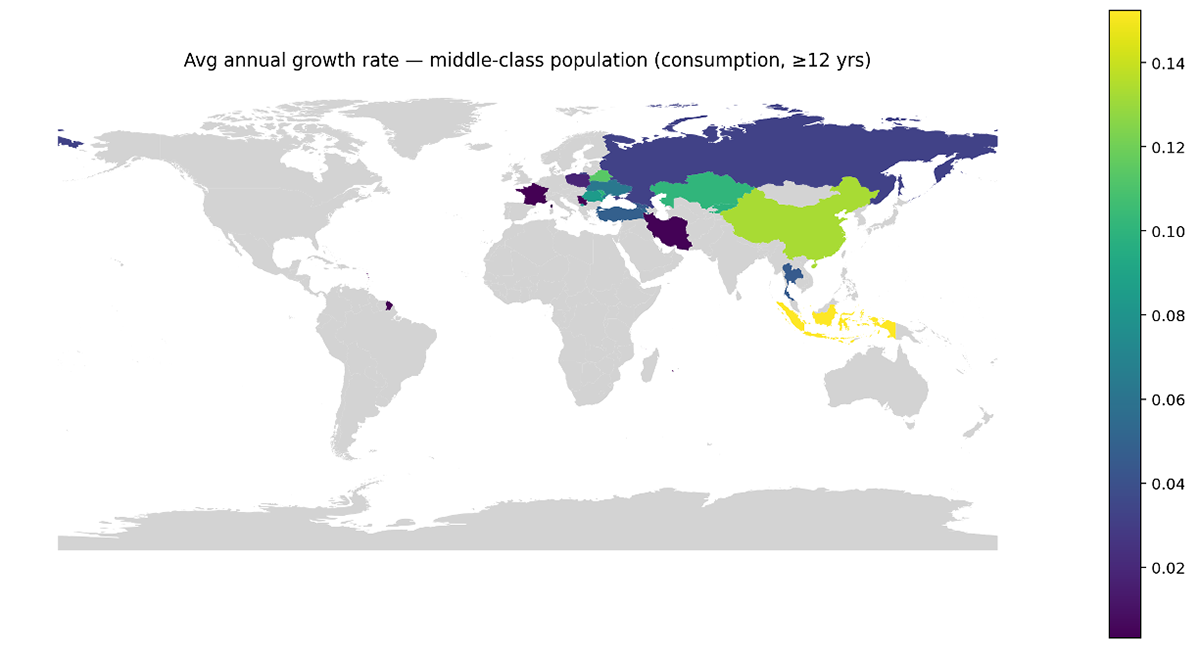
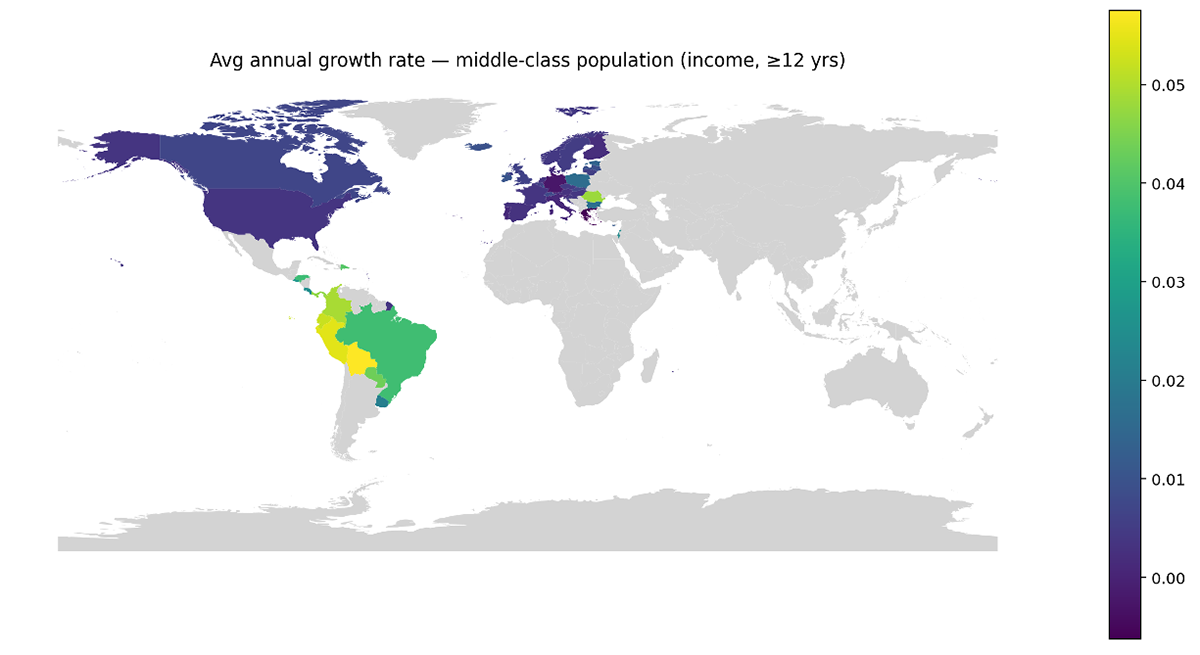
Figure 3 depicts the annual growth rate of the global middle class (GMC) across countries from 2001 to 2021. The map uses a color gradient where darker shades represent slower or negative growth and lighter shades indicate higher positive growth. Some Eastern European and Latin American countries exhibit strong upward trends, with annual growth rates exceeding 3%, signaling rapid middle-class expansion. Conversely, several Western European, Northern European, and North American countries exhibit minimal or negative growth. Since these are mostly wealthier countries, we suspect that few people are crossing the lower threshold into the middle class, and that in fact some people are beginning to earn more than the upper bound middle class salary.
Figure 3: Annual Change in GMC—income and consumption, 2001-2021
Middle Class Income Share
This section describes the share of total income from a country, which belongs to the middle class. In other words, how big is the slice of the pie, for those who lay in this defined middle class? Figure 4 shows the top 20 countries with the highest middle class shares of total income.
This section describes the share of total income from a country, which belongs to the middle class. In other words, how big is the slice of the pie, for those who lay in this defined middle class? Figure 4 shows the top 20 countries with the highest middle class shares of total income.
Figure 4: Top 20 Countries with Largest GMC Share in Income
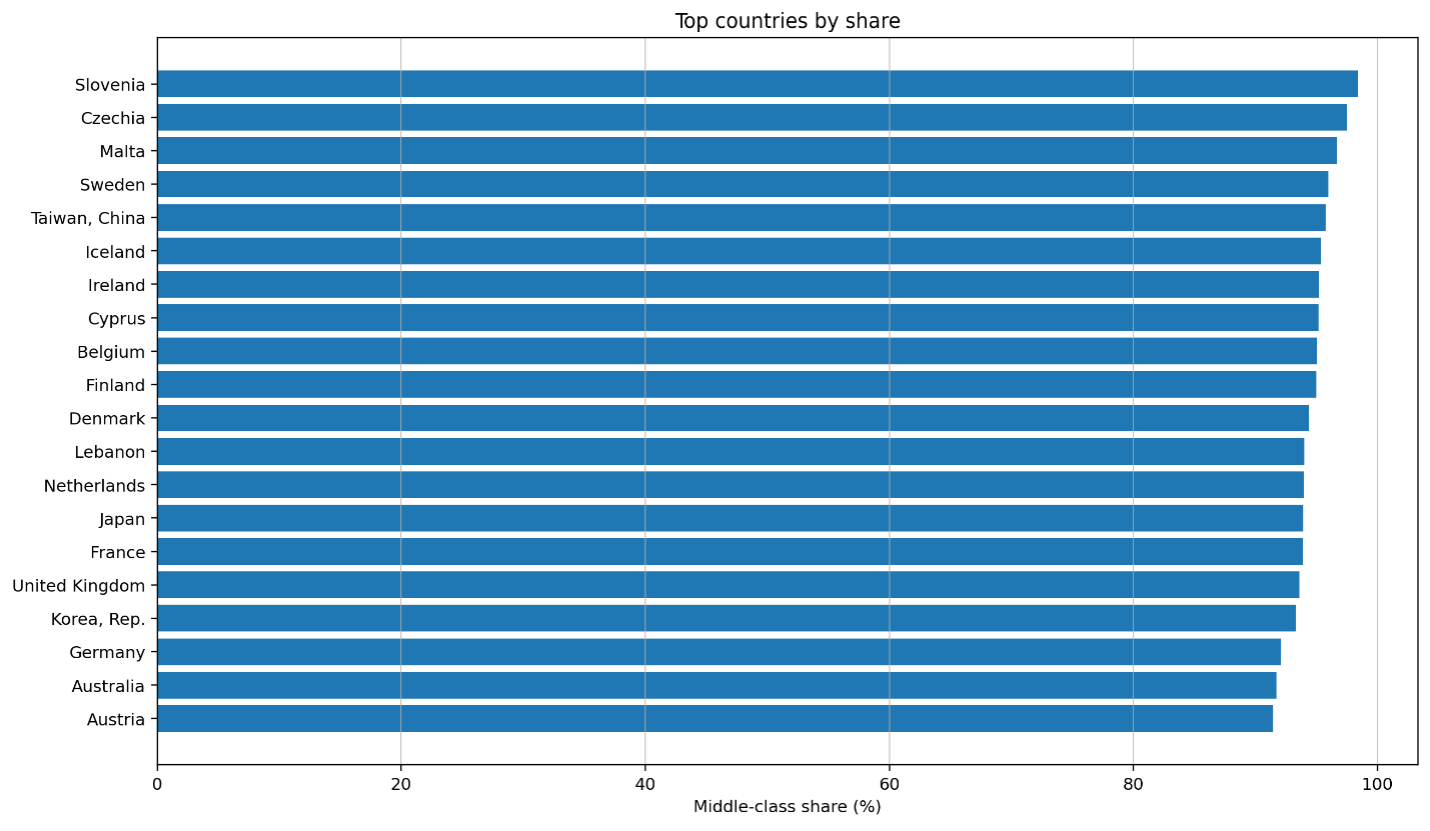
The World Bank labels Taiwan as “Taiwan, China.” The data is labeled the same for internal consistency, however, this is not indicative of any political viewpoints.
Advanced economies dominate the ranking, with Slovenia, Czechia, and Malta approaching almost universal middle class coverage. These countries are also associated with high income stability and broad economic inclusion.
Lebanon appears in this top 20, despite being an EM with a high degree of macroeconomic volatility since its debt crisis in 2019. Its presence suggests that the middle class can be resilient under the right circumstances, even within contexts of political and financial instability.
These trends indicate that future global income and consumption growth will increasingly originate from emerging markets, since DM markets already tend to exhibit a high saturation of middle class population levels.
Figure 5: Top 6 countries with the largest % change - GMC Trend (share %)
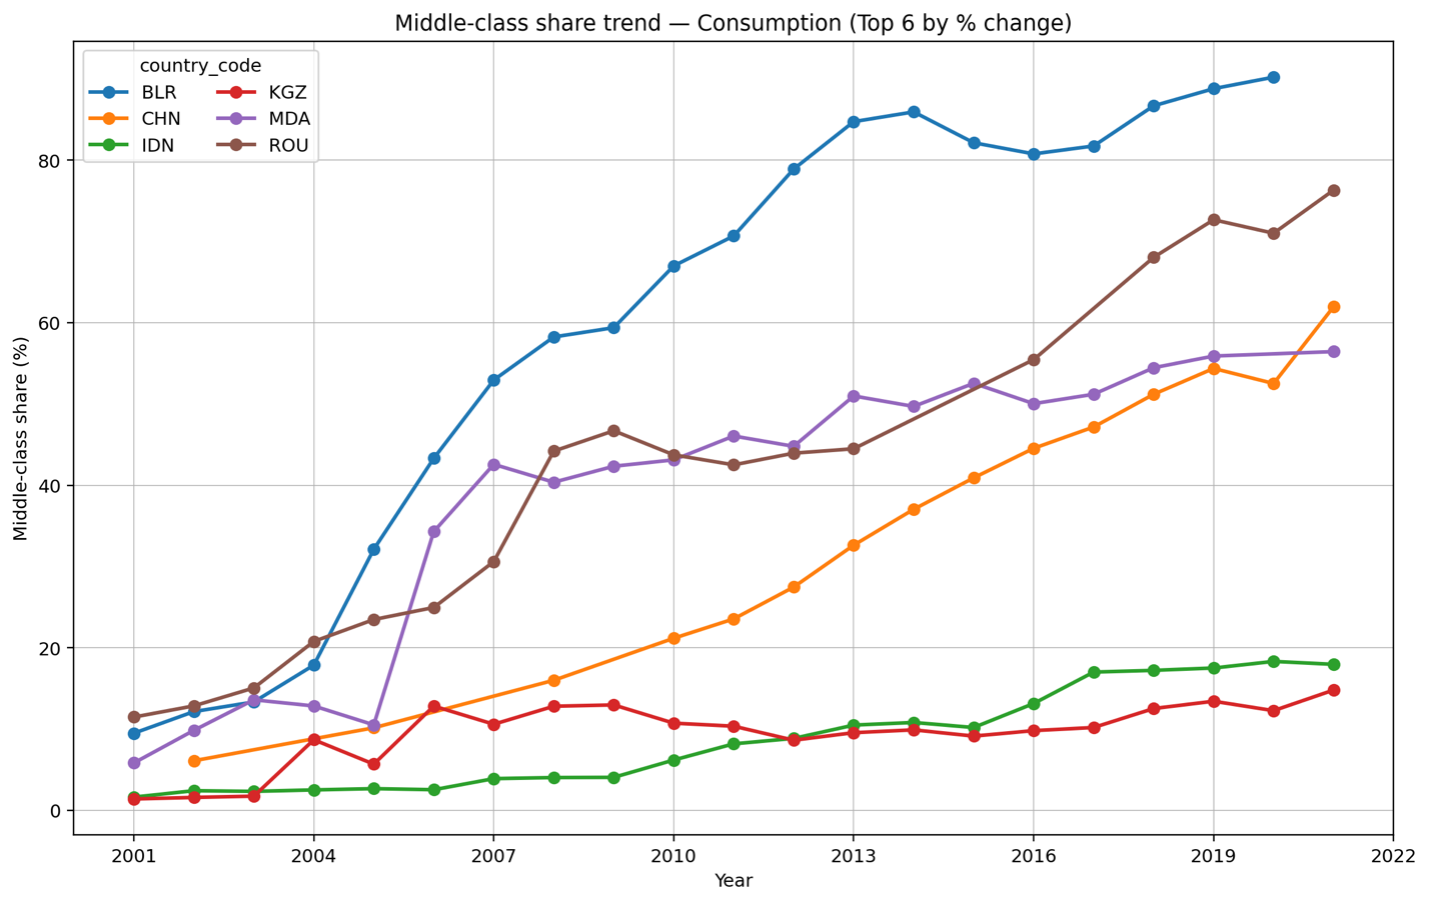
Figure 5 illustrates the change of the middle-class share over time for the six countries with the largest percentage growth and at least twelve data points: Belarus, China, Indonesia, the Kyrgyz Republic, Moldova, and Romania. The most significant increases in middle-class consumption are observed in Eastern Europe and Southeast Asia. In particular, the Eastern European countries experienced rapid expansion in the early 2000s, which later started to stabilize. China stands out for its remarkably steady rise in middle-class share, a notable trend given its concurrently expanding population. Indonesia appears less steep in comparison, yet its progress, from just 1.6% in 2001 to roughly 18% in the final year, is among the strongest in the sample.
This section presents the results of four ordinary least squares (OLS) regressions examining the relationship between the newly defined global middle class share and economic performance, measured by GDP per capita and GDP growth. The models incorporate country and year fixed effects, and include standard macroeconomic controls (inflation, credit to GDP, and trade openness). Two specifications also include the unemployment rate to test robustness. Cluster-robust standard errors are used throughout.
Table 1. Regression Results
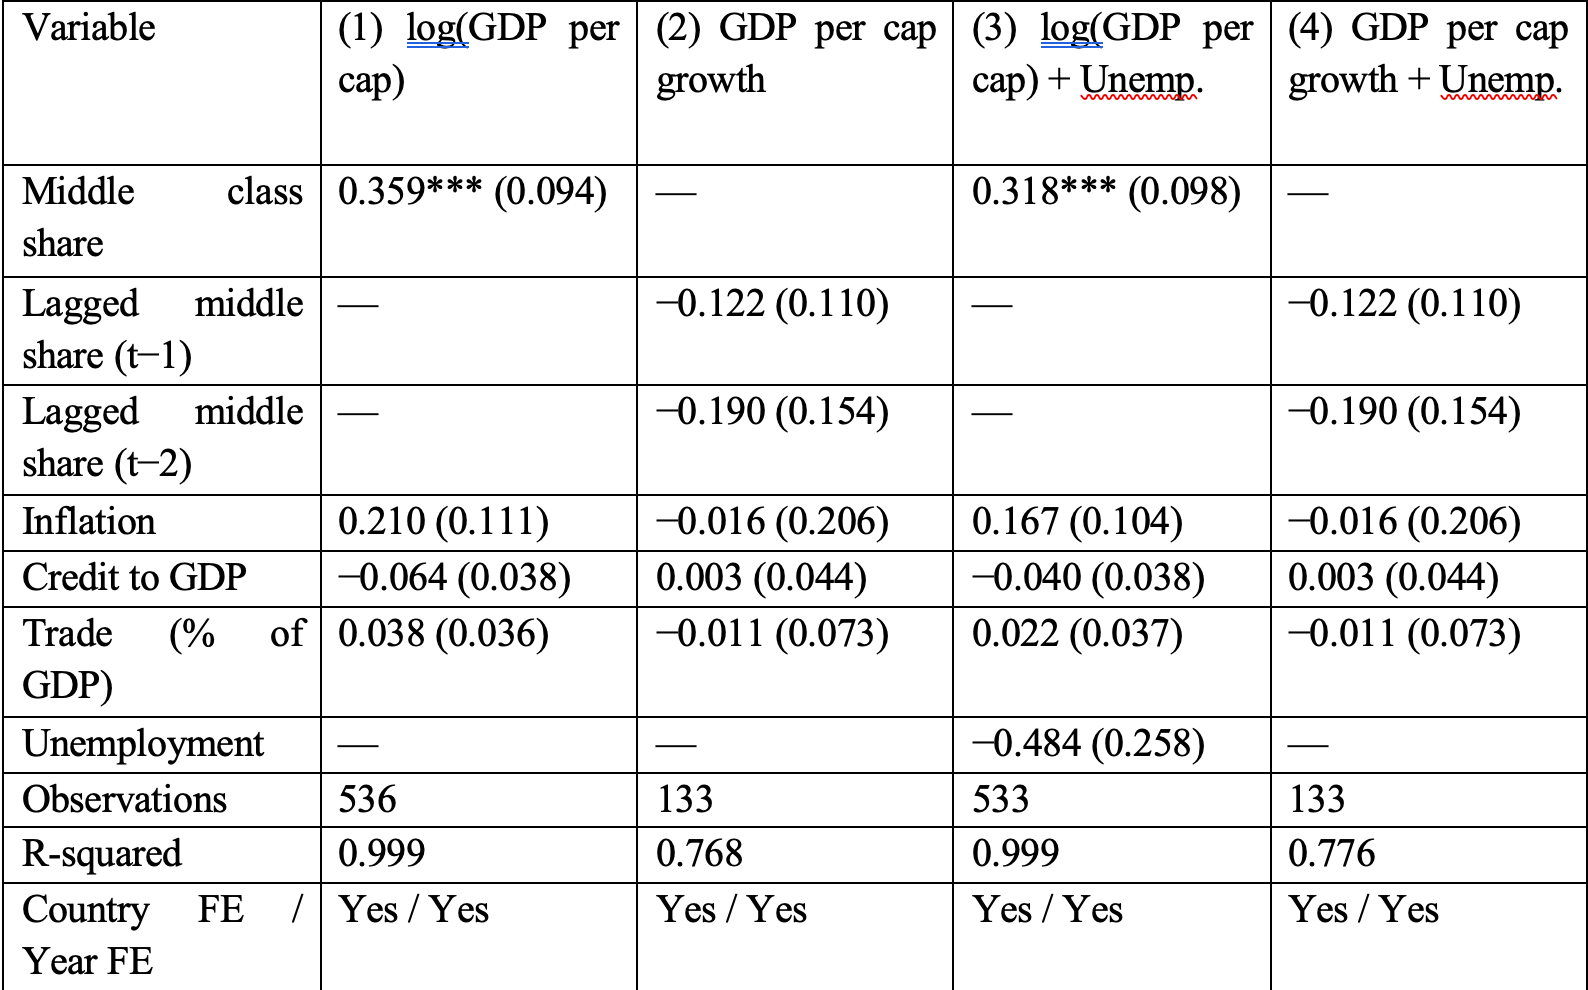
Notes: Clustered standard errors in parentheses. *** p < 0.01, ** p < 0.05, * p < 0.1. Dependent variable is log of GDP per capita (columns 1 and 3) or its growth rate (columns 2 and 4).
The results indicate a strong, stable, and statistically significant relationship between the middle-class share and long-run income levels across 119 countries from 2001-2021. In the baseline specification, the coefficient on middle_share is 0.359 (SE 0.094, z = 3.82, p < 0.001), implying that a 10-percentage-point increase in the middle-class share is associated with approximately a 3.6% higher GDP per capita within a country. The 95% confidence interval ranges from +1.75% to +5.44%. When unemployment is added as a control, the coefficient remains positive and significant at 0.318 (SE 0.098, p = 0.001), demonstrating the robustness of the result. Controls such as inflation, credit-to-GDP, and trade openness are small and statistically imprecise, suggesting that the middle-class variable captures a substantial share of cross-country income variation. The very high R² values (~0.999) largely reflect the inclusion of country and year fixed effects rather than predictive power per se.
The results indicate a strong, stable, and statistically significant relationship between the middle-class share and long-run income levels across 119 countries from 2001-2021. In the baseline specification, the coefficient on middle_share is 0.359 (SE 0.094, z = 3.82, p < 0.001), implying that a 10-percentage-point increase in the middle-class share is associated with approximately a 3.6% higher GDP per capita within a country. The 95% confidence interval ranges from +1.75% to +5.44%. When unemployment is added as a control, the coefficient remains positive and significant at 0.318 (SE 0.098, p = 0.001), demonstrating the robustness of the result. Controls such as inflation, credit-to-GDP, and trade openness are small and statistically imprecise, suggesting that the middle-class variable captures a substantial share of cross-country income variation. The very high R² values (~0.999) largely reflect the inclusion of country and year fixed effects rather than predictive power per se.
In contrast, the growth regressions—using lags and leads of the middle-class share—do not yield statistically significant results. This indicates that changes in the size of the middle class are not immediately associated with short-term growth fluctuations, but rather correspond to long-run structural differences in income levels.
Overall, the findings suggest that while the middle-class share is not a short-run predictive driver of growth, it is a meaningful long-term correlate of higher national income levels. Future iterations could explore dynamic models with lag structures, interaction terms, or alternative middle-class definitions to better capture temporal effects and causal pathways.
Areas for Improvement
There are flaws with this methodology and data representation. They come up as follows:
There are flaws with this methodology and data representation. They come up as follows:
Nominal vs. PPP metric
Nominal currency allows for better analysis of living standards within each country, which is an important consideration for middle class. Furthermore, exchange rates matter when considering the middle class as a consumer, and PPP does not accurately encompass real time currency fluctuations.
Nominal currency allows for better analysis of living standards within each country, which is an important consideration for middle class. Furthermore, exchange rates matter when considering the middle class as a consumer, and PPP does not accurately encompass real time currency fluctuations.
Broad definition
$10-$110 dollars per day encompasses a large variety of individuals. Annualized, we consider a range of incomes from $3,650 to $40,150. Though this allows for the greatest flexibility in considering the middle class globally, this metric does not allow for accurate consideration in each country.
$10-$110 dollars per day encompasses a large variety of individuals. Annualized, we consider a range of incomes from $3,650 to $40,150. Though this allows for the greatest flexibility in considering the middle class globally, this metric does not allow for accurate consideration in each country.
For this reason, the concept of a global middle class is best used as supplementary metric. Just as in real estate calculations, one cannot determine the health of an investment solely on NOI, IRR, or Cash on Cash flows, one should not rely on the global middle class as the sole statistic for global standard of living. On the contrary, this metric is most useful in conjunction with other macroeconomic indicators, and can be levied to gauge market direction and demographic trend/overall health.
Furthermore, the entry threshold into the middle class, in theory, is very precarious. Speculatively, there is a high volume of people that are in danger of falling out of the middle class in the face of economic adversity.
Furthermore, the entry threshold into the middle class, in theory, is very precarious. Speculatively, there is a high volume of people that are in danger of falling out of the middle class in the face of economic adversity.
In the face of this precarity, we posit the concept of a “formal middle class”, which is defined under the same parameters with an additional caveat of asset ownership. Durable machinery, vehicles, land and other assets can serve as a buffer in economic downturn and could yield a more stable representation of a middle class. In this measure, we are subject to data availability. With strides in data collection, will come improved research on the global middle class.
Data collection
Current Data collection methods do not allow for the most robust analysis. Most countries measure in various welfare types and do not survey annually. Furthermore, in countries with elevated levels of informality, and little central institutionalization, data is subject to errors.
Current Data collection methods do not allow for the most robust analysis. Most countries measure in various welfare types and do not survey annually. Furthermore, in countries with elevated levels of informality, and little central institutionalization, data is subject to errors.
Correlations
While we explored the relationship between middle-class growth and key macroeconomic indicators—including GDP, GDP per capita (PPP), infant mortality, life expectancy, and unemployment—none of the correlations were statistically significant across the Pearson, Spearman, or Kendall methods. This suggests that, within our 2001–2021 panel, short-term changes in middle-class size may not directly co-move with annual shifts in these indicators, or that the relationships are non-linear and obscured by country-level heterogeneity. The lack of significance highlights a key limitation of simple correlation analysis for complex macroeconomic dynamics. Future work could refine these tests by using detrended or lagged time-series models (e.g., VAR or fixed-effects regressions) to capture delayed or structural effects more accurately.
While we explored the relationship between middle-class growth and key macroeconomic indicators—including GDP, GDP per capita (PPP), infant mortality, life expectancy, and unemployment—none of the correlations were statistically significant across the Pearson, Spearman, or Kendall methods. This suggests that, within our 2001–2021 panel, short-term changes in middle-class size may not directly co-move with annual shifts in these indicators, or that the relationships are non-linear and obscured by country-level heterogeneity. The lack of significance highlights a key limitation of simple correlation analysis for complex macroeconomic dynamics. Future work could refine these tests by using detrended or lagged time-series models (e.g., VAR or fixed-effects regressions) to capture delayed or structural effects more accurately.
Conclusion
The global middle class is not a static demographic, it is dynamic, shaped by structural factors in labor markets, consumption patterns, and macroeconomic volatility. Our analysis shows that nearly half of the population in sampled countries now falls within this income band, but the distribution is uneven and the trajectory is fragile. Emerging markets are driving the expansion, yet the entry threshold remains precarious, and the risk of reversal is real.
The global middle class is not a static demographic, it is dynamic, shaped by structural factors in labor markets, consumption patterns, and macroeconomic volatility. Our analysis shows that nearly half of the population in sampled countries now falls within this income band, but the distribution is uneven and the trajectory is fragile. Emerging markets are driving the expansion, yet the entry threshold remains precarious, and the risk of reversal is real.
This matters. A robust middle class is not just a byproduct of growth, but rather a precondition for it. Our regression analysis confirms what policymakers often intuit: countries with a larger middle class tend to have higher income levels over time. But correlation is not causation, and the path from middle-class expansion to sustained prosperity is not automatic. It must be approached intentionally with formalization, asset accumulation, and institutional trust.
If the global middle class is to be more than a statistical artifact, it must be treated as a strategic priority. That means rethinking development through the lens of the consumer: not just how many people escape poverty, but how many stay out of it. It means investing in the infrastructure of economic security — from credit access to social protection — and recognizing that middle-class fragility is a global risk, not just a national one. Even so, progress continues. The middle class worldwide is the largest ever observed in human history and remains on track to grow. Optimism is not irrational; it is proof-of-concept that governments and economists can derive positive impact on standard of living on a global scale.
The middle class is not a Western export. It is a global phenomenon with local expressions. Its future will be written in Nairobi and Dhaka as much as in Brussels or New York. Understanding its contours is not just an academic exercise — it’s a prerequisite for building a more stable, inclusive global economy.
Banerjee, A. V., & Duflo, E. (2008). What is Middle Class about the Middle Classes around the World? Journal of Economic Perspectives, 22(2), 3–28.
Datt, Gaurav. 1998. “Computational Tools for Poverty Measurement and Analysis.”
CEIC Data, "South Korea Annual Household Income per Capita," CEIC Data, accessed May 20, 2025, https://www.ceicdata.com/en/indicator/korea/annual-household-income-per-capita.
Kharas, Homi. 2023. The Rise of the Global Middle Class: How the Search for the Good Life Can Change the World. Washington, DC: Brookings Institution Press.
Homi Kharas, The Unprecedented Expansion of the Global Middle Class: An Update (Washington, DC: The Brookings Institution, 2017).
Homi Kharas and Kristofer Hamel, “Defining the Middle Class: Cash, Credentials, or Culture?,” Brookings Institution, July 26, 2018, https://www.brookings.edu/articles/defining-the-middle-class-cash-credentials-or-culture/.
Peter Lanjouw and Nora Lustig, Consumption and Income (World Bank, January 2000).
Oxford Economics. (2024). The Future of the Middle Class in Emerging Markets. Oxford Economics White Paper.
Visa & Oxford Economics. (2017). The Geography of the Global Middle Class: Where They Live, How They Spend. Visa Business and Economic Insights.
Infant Mortality rate: https://data.worldbank.org/indicator/SP.DYN.IMRT.IN
Life expectancy at birth: https://data.worldbank.org/indicator/SP.DYN.LE00.IN
Total GDP (2015 $): https://data.worldbank.org/indicator/NY.GDP.MKTP.KD
GDP, PPP and GDP per capita (2021 $): https://data.worldbank.org/indicator/NY.GDP.MKTP.PP.KD
Unemployment percentage (% of total labour force) (ILO estimate): https://data.worldbank.org/indicator/SL.UEM.TOTL.ZS